Fayl:Tyndalls setup for measuring radiant heat absorption by gases annotated.svg

Faylın orijinalı (SVG faylı, nominal olaraq 960 × 893 piksel, faylın ölçüsü: 329 KB)
| Bu fayl "Vikimedia Commons"dadır və digər layihələrdə istifadə edilə bilər. |
 |
Faylın təsvir səhifəsinə get |
Xülasə
| İzah |
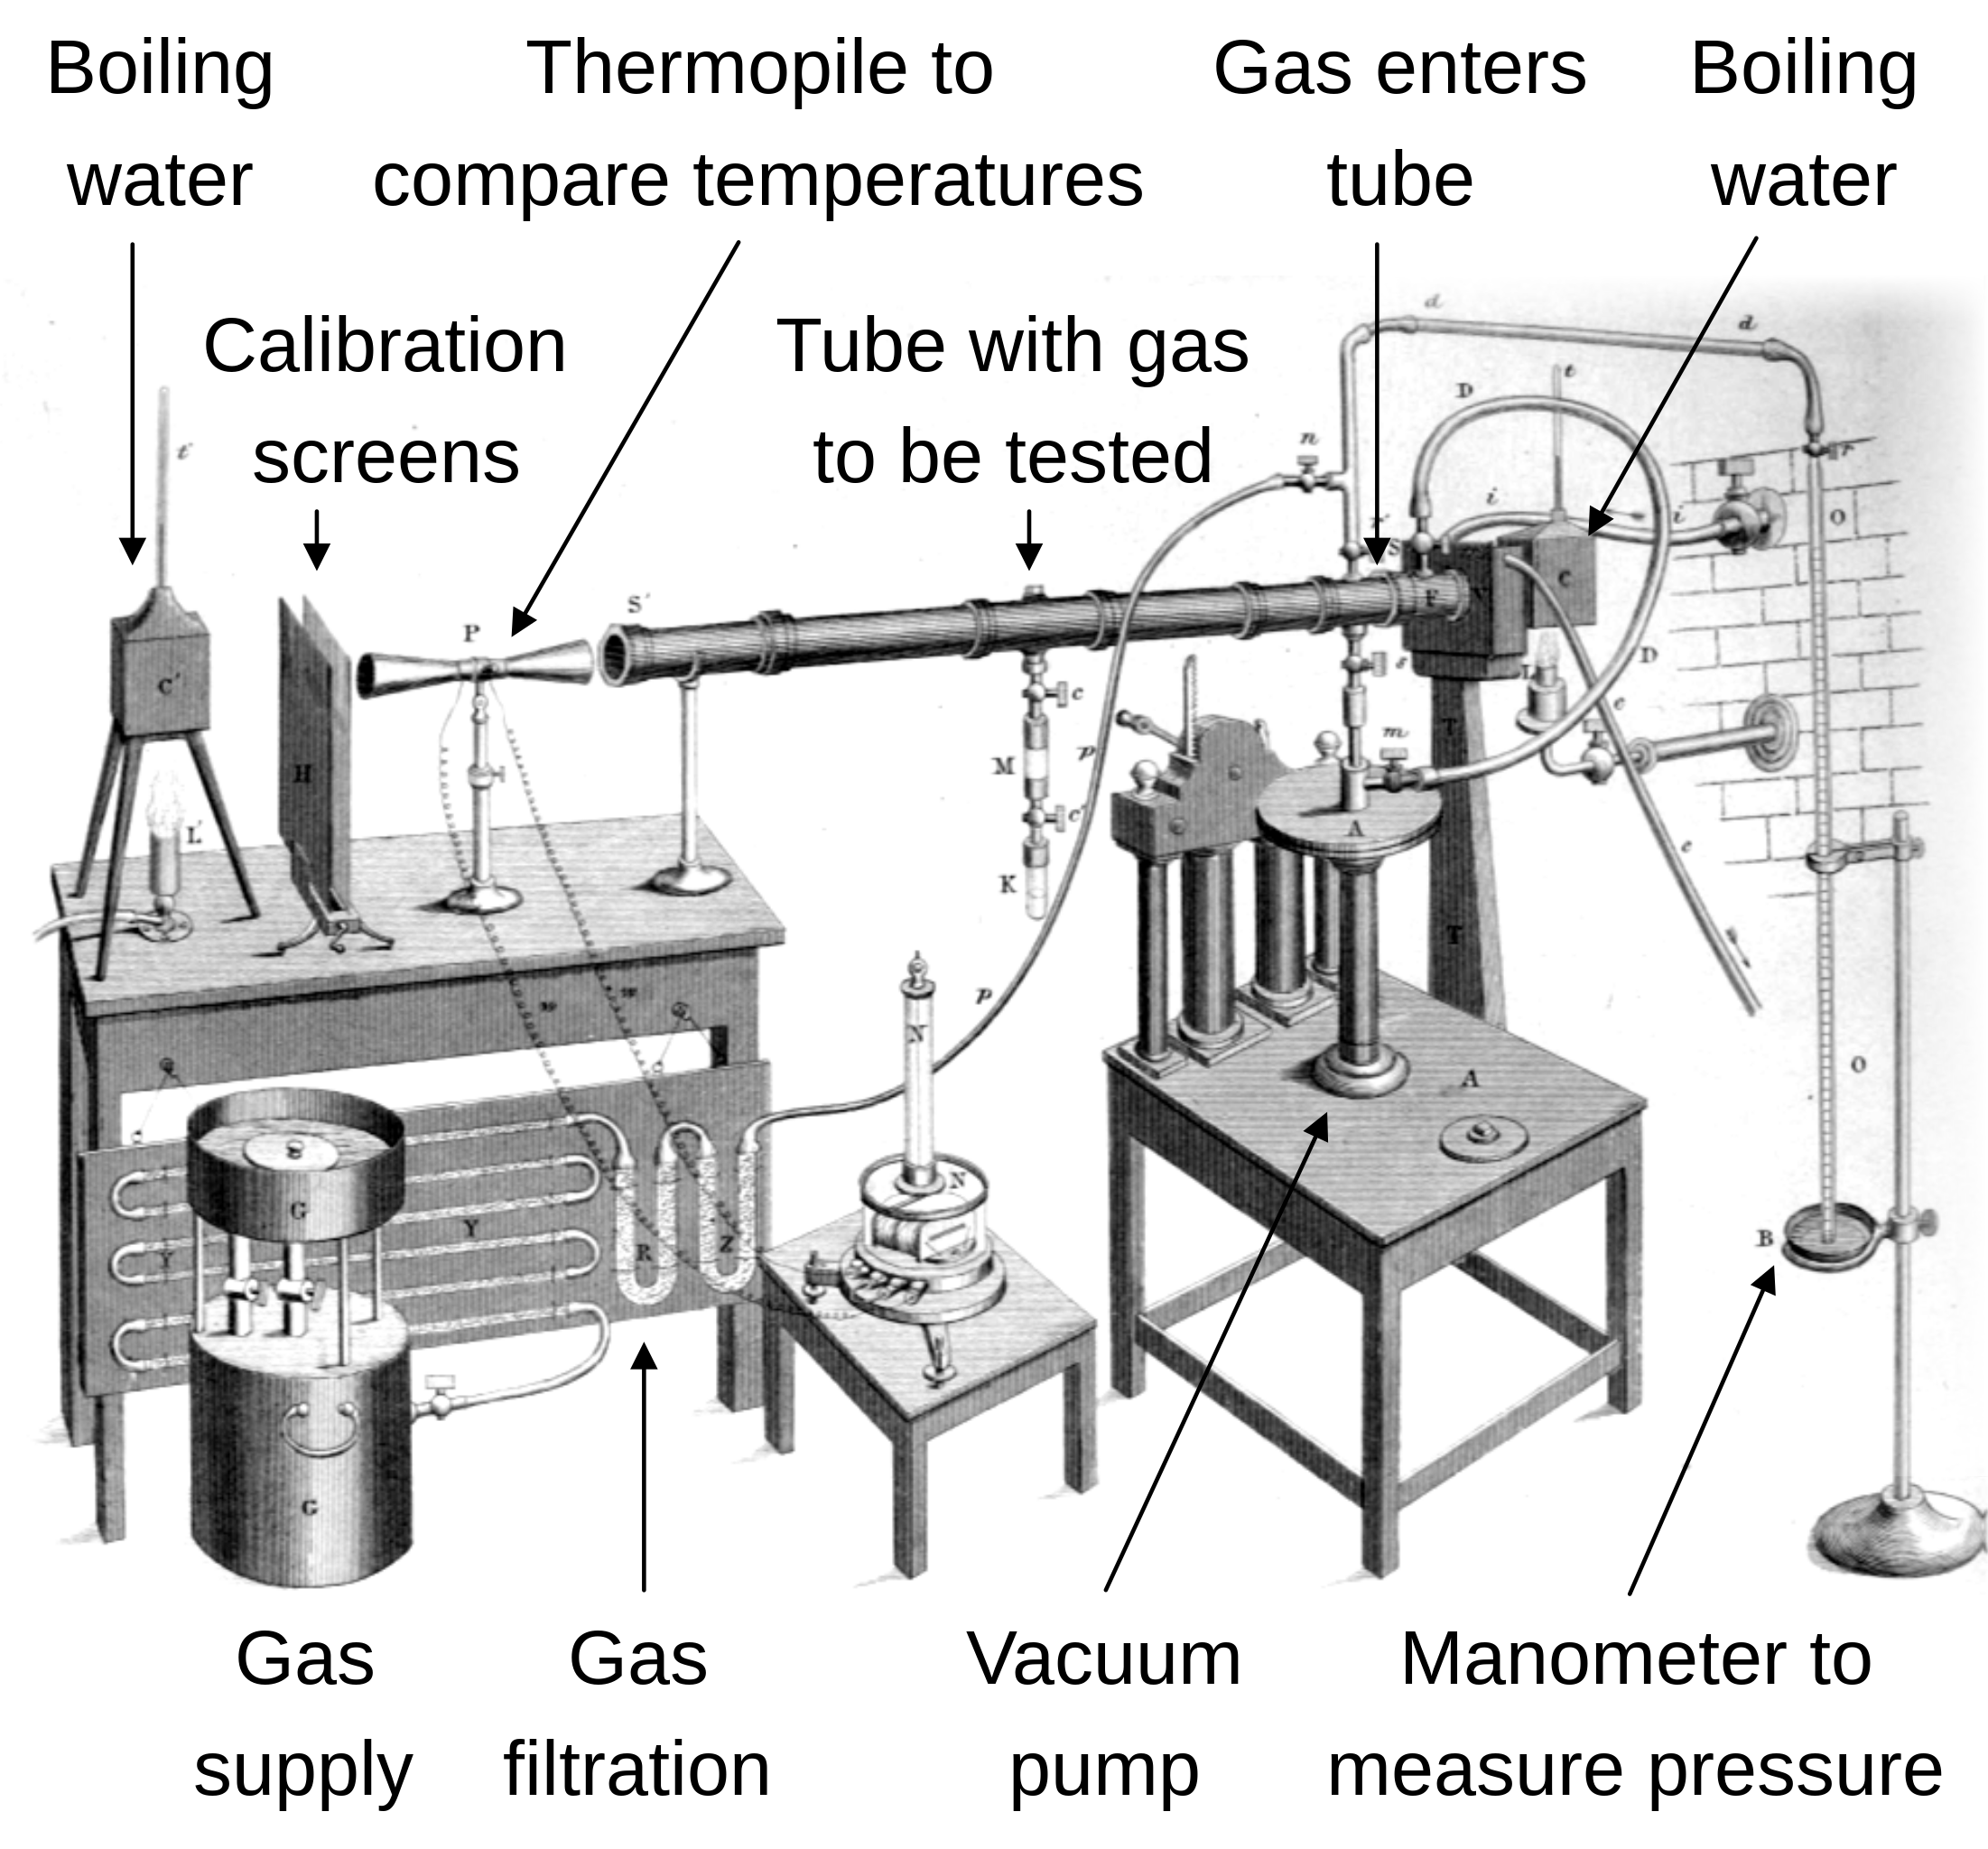
English: Illustration of John Tyndall's setup for measuring the radiant heat absorption of gases. This illustration dates from 1861 and it is taken from one of John Tyndall's presentations where he describes his setup for measuring the relative radiant-heat absorption of gases and vapors. The galvanometer quantifies the difference in temperature between the left and right sides of the thermopile. The reading on the galvanometer is settable to zero by moving the Heat Screen a bit closer or farther from the lefthand heat source. That is the only role for the heat source on the left. The heat source on the righthand side directs radiant heat into the long brass tube. The long brass tube is highly polished on the inside, which makes it a good reflector (and non-absorber) of the radiant heat inside the tube. Rock-salt (NaCl) is practically transparent to radiant heat, and so plugging the ends of the long brass tube with rock-salt plates allows radiant heat to move freely in and out at the tube endpoints, yet completely blocks the gas within from moving out. To begin the measurements, both heat sources are turned on, the long brass tube is evacuated as much as possible with an air suction pump, the galvanometer is set to zero, and then the gas under study is released into the long brass tube. The galvanometer is looked at again. The extent to which the galvanometer has changed from zero indicates the extent to which the gas has absorbed the radiant heat from the righthand heat source and blocked this heat from radiating to the thermopile through the tube. If a highly polished metal disc is placed in the space between the thermopile and the brass tube it will completely block the radiant heat coming out of the tube from reaching the thermopile, thereby deflecting the galvanometer by the maximum extent possible with respect to blockage in the tube. Thus the system has minimum and maximum readings available, and can express other readings in percentage terms. (The galvanometer's responsiveness was physically nonlinear, but well understood, and mathematically linearizable.)
In one of his public lectures to non-professional audiences Tyndall gave the following indication of instrument sensitivity: "My assistant stands several feet off. I turn the thermopile towards him. The heat from his face, even at this distance, produces a deflection of 90 degrees [on the galvanometer dial]. I turn the instrument towards a distant wall, judged to be a little below the average temperature of the room. The needle descends and passes to the other side of zero, declaring by this negative deflection that the pile feels the chill of the wall." (quote from Six Lectures On Light). To reduce interference from human bodies, the galvanometer was read through a telescope from across the room. The thermopile & galvanometer system was invented by Leopoldo Nobili and Macedonio Melloni. Melloni measured radiant heat absorption in solids and liquids but didn't have the sensitivity for gases. Tyndall greatly improved the sensitivity of the overall setup (including putting an offsetting heat source on the other side of the thermopile, and putting the gas in a brass tube), and as a result of his superior apparatus he was able to confidently reach conclusions that were quite different from Melloni's concerning radiant heat in gases (book ref below, in chapter I). Air from which water vapor and carbon dioxide had been removed deflected the galvanometer dial by less than 1 degree, in other words a detectable but very small amount (same ref, chapter II). Many other gases and vapors deflected the galvanometer by a large amount -- thousands of times greater than air. As a check on his system's reliability, Tyndall painted the inside walls of the brass tube with a strong absorber of radiant heat (namely lampblack). This greatly reduced the radiant heat that reached the thermopile when the tube was empty. Nevertheless the percentage absorptions by the different gases and vapors relative to the empty tube were largely and essentially unchanged by this change to the absorption property of the tube's walls. That's excluding a few gases and vapors such as chlorine that must be excluded because they tarnish brass, changing its heat reflectivity. As another test of the reliability of the system, the long brass tube was cut to about a quarter of its original length, and the exact same quantity of gas was released into the shorter tube. Thus the shorter tube will have about four times higher gas density. It was found that the percentage of radiant heat absorbed by or transmitted through the gas relative to the empty-tube state was entirely unchanged by this (even though the two tubes don't have equal empty-tube states). Varying the absolute quantity of the gas in the tube causes corresponding changes in the absorption percentages, but varying the density doesn't matter, nor does the absolute value of the empty-tube reference point. The emission spectrum of the particular source of heat makes a difference -- sometimes a big difference -- in the amount of radiant heat a gas will absorb, and different gases can respond differently to a change in the source. Tyndall said in 1864, "a long series of experiments enables me to state that probably no two substances at a temperature of 100°C emit heat of the same quality [i.e. of the same spectral profile]. The heat emitted by isinglass, for example, is different from that emitted by lampblack, and the heat emitted by cloth, or paper, differs from both." Looking at an electrically-heated platinum wire, it is obvious to the human eye that the heat's spectral profile depends on whether the wire is heated to dull red, bright orange, or white hot. Some gases were relatively stronger absorbers of the dull-red platinum heat while other gases were relatively stronger absorbers of the white hot platinum heat, he found. For his original and primary benchmark in 1859, he used the heat from 100°C lampblack (akin to a theoretical "blackbody radiator"). Later he got some of his more interesting findings from using other heat sources. E.g., when the source of radiant heat was any one kind of gas, then this heat was strongly absorbed by another body of the same kind of gas, regardless of whether the gas was a weak absorber of broad-spectrum sources. In the illustration above, the radiant heat that is going into the brass tube comes from a pot of simmering water; the heat radiates from the exterior surface of the pot, not from the water, and not from the gas flame that keeps the water at a simmer. An alternative illustration with a modified setup taken from the same book (page 112) is shown below. The main difference is that the heat source is separated from the brass tube by open air, which eliminates the need for circulating cold water cooling at the interface between heat source and brass tube. |
| Tarix | |
| Mənbə | I. The Bakerian Lecture.—On the absorption and radiation of heat by gases and vapours, and on the physical connexion of radiation, absorption, and conduction. It has been subsequently annotated. |
| Müəllif | John Tyndall |
| Digər versiyalar |
|

Lisenziya
|
This work is in the public domain in its country of origin and other countries and areas where the copyright term is the author's life plus 70 years or fewer. This work is in the public domain in the United States because it was published (or registered with the U.S. Copyright Office) before January 1, 1929. | |
| This file has been identified as being free of known restrictions under copyright law, including all related and neighboring rights. | |
Faylın tarixçəsi
Faylın əvvəlki versiyasını görmək üçün gün/tarix bölməsindəki tarixlərə klikləyin.
| Tarix/Vaxt | Kiçik şəkil | Ölçülər | İstifadəçi | Şərh | |
|---|---|---|---|---|---|
| indiki | 18:30, 23 avqust 2020 | | 960 × 893 (329 KB) | Efbrazil | Uploaded a work by John Tyndall from The illustration appears in John Tyndall's 1872 book "''Contributions to Molecular Physics in the Domain of Radiant Heat''" ([https://archive.org/search.php?query=contributions%20to%20molecular%20physics%20in%20the%20domain%20of%20radiant%20heat downloadable at Archive.org]). It has been subsequently annotated in colored typeface. The book is a compilation of research reports published by Tyndall in the 1860s. The particular illustration is part of a repor... |
Fayl keçidləri
Aşağıdakı səhifə bu faylı istifadə edir:
Faylın qlobal istifadəsi
Bu fayl aşağıdakı vikilərdə istifadə olunur:
- cs.wikipedia.org layihəsində istifadəsi
- en.wikipedia.org layihəsində istifadəsi
- pl.wikipedia.org layihəsində istifadəsi
- pt.wikipedia.org layihəsində istifadəsi
- zh.wikipedia.org layihəsində istifadəsi